This week I completed the assigned Matplotlib tasks 0-2. Matplotlib is a graphing library for python. These helped me gain a better understanding of Matplotlib by explaining small portions of the library. Task 0 walked through Numpy arrays, task 1 explained the basics of matplotlib, and task 2 explained some more advanced plotting functions.
Task 0 had no questions, and hence the task was quite easy - just requiring some reading. Questions help me to remember and understand the content I am learning, and without them, I end up forgetting the content. As this task had no questions, I cannot even remember how to create a numpy array. Although my understanding of Numpy arrays is limited, it will improve as I continue to look further into matplotlib, as the two are closely intertwined.
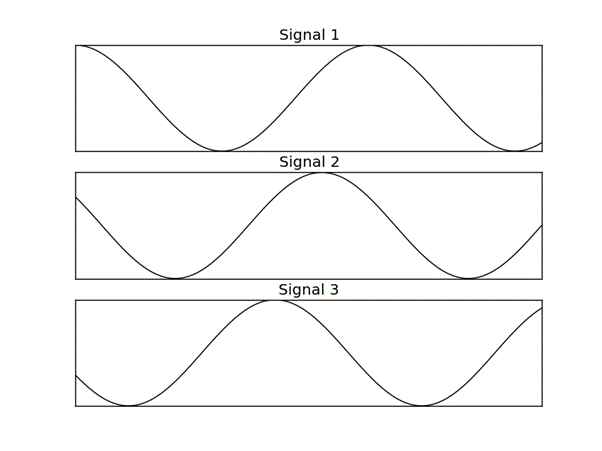
Task 1 was simple, as it only covered 2 functions - the creation of axes/subplots, and the plot function. These two functions or a varient are essential for almost any matplotlib graph, so it was good to get a somewhat-solid understanding. Task 1 had a question at the end, so it consolidated my knowledge, and I now actually remember the two functions - subplots() and plot(). The question was to imitate a graph of a sine wave with multiple different modifiers, the solution is below.
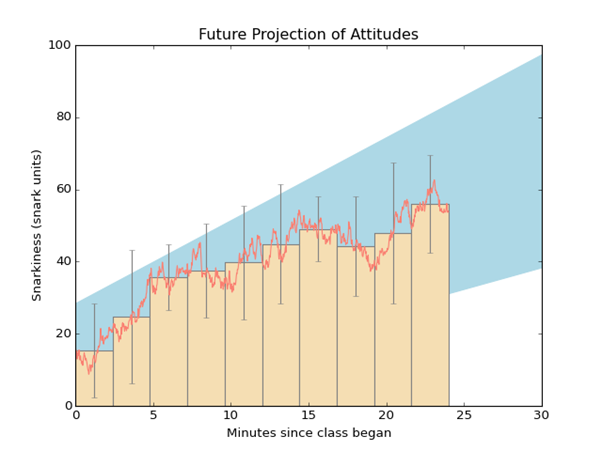
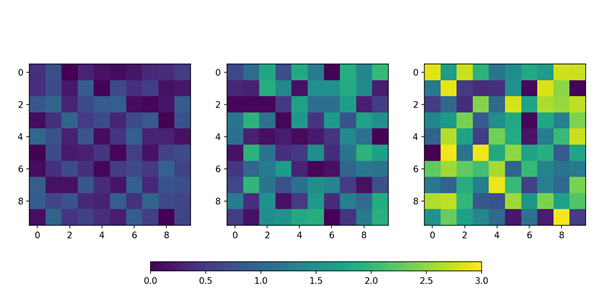
Task 2 was the hardest of the 3, requiring the use of 4 more advanced plotting functions - bar(), fill_between(), imshow(), and colorbar(). The task had 2 questions requiring the use of these functions. Question 1 involved recreating a graph involving a line plot, a bar plot, and a fill plot. The data was given, and was simple to recreate, the only difficult part being the error bars on the bar graph. Question 2 was more difficult, as I could not get the correct colors on each of the imshow() plots. This was simply because I did not have the correct xlim value. The two solutions can be found below.